Web AppBuilder for ArcGIS(Developer Edition)ではオリジナルのウィジェットを作れますが、そこでパネルを表示する方法です。
Table of Contents
ゴール
作成したウィジェットを下の本のアイコンをクリックして起動すると、
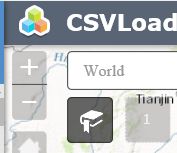
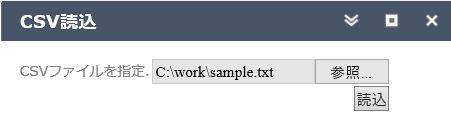
下記のようなパネルを表示する手順を説明します。
htmlファイル
パネルファイルはhtmlファイルでテンプレートを作成します。
ウィジェットフォルダ直下に「Widget.html」ファイルを作成してください。
<div>
<table>
    <tr>
        <td>${nls.labelInput}.</td><td><input type='file' id='inputCsvLoaderFile' /></td>
    </tr>
    <tr>
        <td colspan='2' align='right'><input type='button' value='${nls.btnRead}' id='btnCsvLoaderRead' onclick='return false;' /></td>
    </tr>
</table>
</div>
上記htmlファイルには、「${nls.labelInput}」のような多言語対応の文字列設定があります。
ユーザのブラウザ設定の言語を見て適切な文字列に置き換えてくれます。私は日本語ブラウザでテストしたので上記スクリーンショットは日本語ででています。
この設定は、ウィジェットフォルダ直下の「nls」フォルダで行います。
nlsフォルダ直下は以下のようにファイルを作ります。
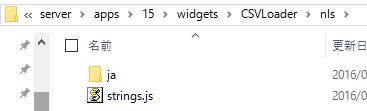
strings.jsは下記内容。英語のときは、htmlファイルでnls.labelInputと記述した場所に「Select CSV file」と表示。
define({
  root: {
    labelInput: "Select CSV file",
    btnRead: "Read",
    _widgetLabel: "Load CSV",
  },
  "ja": 1
});
jaフォルダはユーザのブラウザが日本語設定の時に利用する文字列を定義する場所です。
jaフォルダには日本語用strings.jsを作成。
define({
    labelInput: "CSVファイルを指定",
    btnRead: "読込",
    _widgetLabel: "CSV読込",
})
manifest.json
上記変更をしても、このファイルを正しく設定しておかないとJavaScriptエラーが出たりしてうまく動きません。
{
  "name": "CSVLoader",
  "2D": true,
  "3D": true,
  "platform": "HTML",
  "version": "2.0.1",
  "wabVersion": "2.0.1",
  "author": "渡部 潤司",
  "description": "CSVファイルに格納された緯度/経度を利用して、地図上にポイントを表示します。",
  "copyright": "(C) 2016 ハウスソフト",
  "license": "http://www.apache.org/licenses/LICENSE-2.0",
  "properties": {
		"inPanel":true,
		"hasLocale": true,
		"supportMultiInstance":false,
		"hasStyle":true,
		"hasConfig":false,
		"hasUIFile":true    ,
		"keepConfigAfterMapSwitched":false,
		"hasSettingPage":false,
		"hasSettingUIFile":false,
		"hasSettingLocale":false,
		"hasSettingStyle":false,
		"IsController":false
  }
}
hasUIFile:Widget.htmlを正しく読んでもらうためにtrueにする必要がある
hasLocale:nlsフォルダに設定したらtrueにする
作ったウィジェットの動作を確認してみる
Widget.jsを以下の様に、「ボタンクリック時に選択されたファイルの中身をポップアップさせる」ように変更。
startupメソッドは、ウィジェットの用意ができたら呼び出されます。
define(['dojo/_base/declare', 'jimu/BaseWidget', 'dojo/on', 'dojo/dom'],
function(declare, BaseWidget, on, dom) {
	return declare([BaseWidget], {
        startup: function() {
            var button = dom.byId('btnCsvLoaderRead'),
                file = dom.byId('inputCsvLoaderFile');

            this.own(
                on(button, 'click', function(evt) {
                    var reader = new FileReader();
                    reader.onload = function(){
                        alert(reader.result);
                    };
                    reader.readAsText(file.files[0]);
                })
            );
        }

	});
});
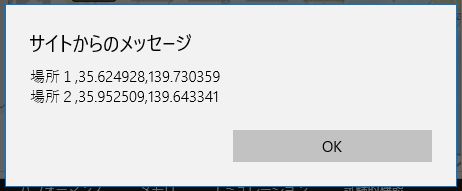
UTF8で作ったファイルを選択して、「読込」ボタンをクリックすると下記ポップアップが出る(Chromeでテスト)
ファイルが読めたので、座標を含んだCSVファイルを読んで、GraphicLayerを定義して地図上に表示できるようになるはず。